
Data analytics helps businesses make better decisions by turning raw data into clear, actionable insights. It shows what works, what does not, and what to do next. Leaders replace guesses with facts, which lowers risk and improves results.
Every business already holds useful data. Sales records, website visits, and customer feedback all tell a story. Analytics reads that story and turns it into a plan.
IBM explains data-driven decision making well if you want another expert view. This guide shows how it works, step by step, in plain words
What Is Data-Driven Decision Making?
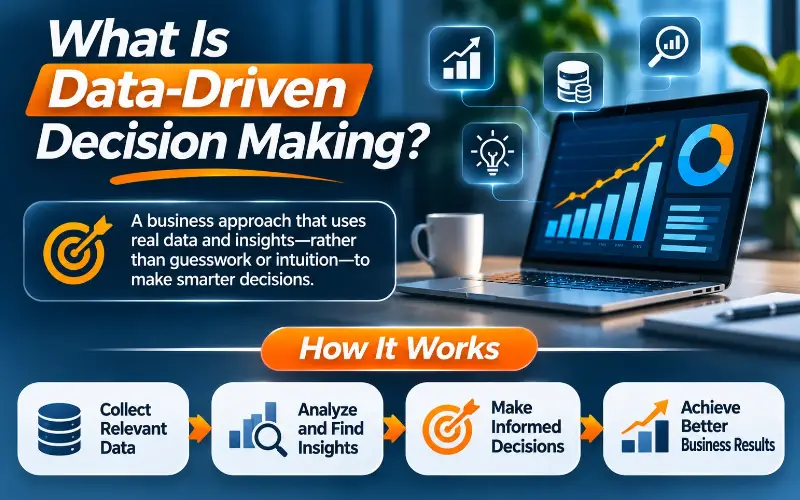
Data-driven decision making means choosing actions based on evidence, not gut feeling. Teams look at real numbers before they commit time and money. They test ideas, measure results, and adjust fast.
Gut feeling still has a place. Experience matters. But data checks that instinct and catches blind spots. The best leaders use both.
If you are new to the topic, start with our guide on what data analytics is. It covers the basics before you go deeper here.
The Data Analytics Process Behind Better Decisions
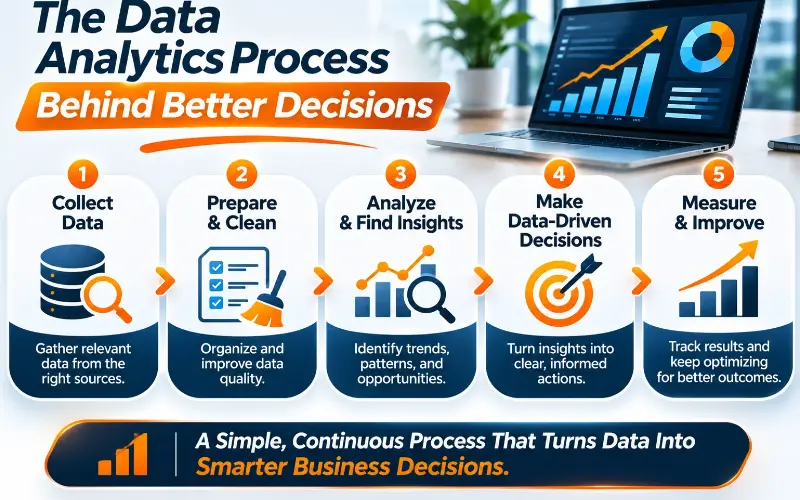
Good decisions follow a simple path. Each stage builds on the one before it.
1. Data Collection
Data collection gathers information from your sources. These include sales tools, websites, apps, surveys, and social media. Collect only what supports your goals.
2. Data Processing
Data processing cleans and organizes raw data. It removes duplicates, fixes errors, and joins related records. This step makes data ready for use.
3. Data Analysis and Interpretation
Analysts study the clean data for patterns and trends. Data interpretation then explains what those patterns mean. A number alone means little without context.
4. Data Reporting and Data Visualization
Data reporting shares findings with decision-makers. Data visualization makes them easy to grasp. Charts and dashboards beat long spreadsheets every time.
5. Action and Review
The final step turns insight into action. Teams make a change, track the results, and learn from them. Then the cycle starts again.
Key Ways Data Analytics Improves Business Decisions
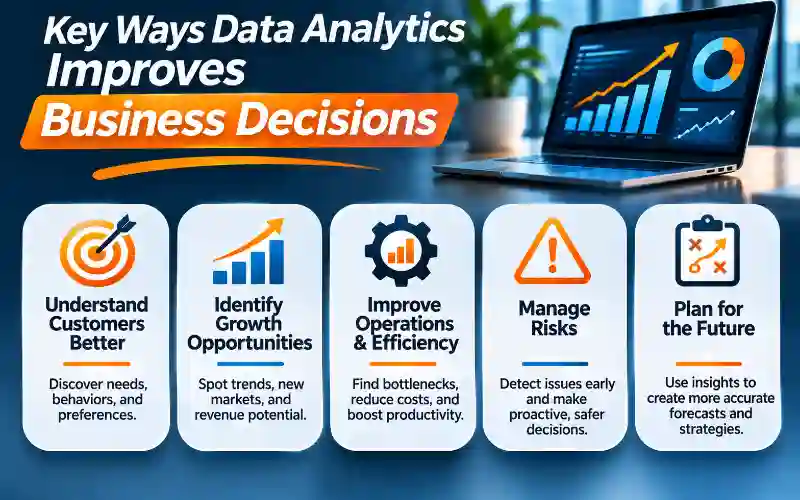
Analytics supports almost every part of a business. Here are the main areas where it makes a real difference.
Business Performance Analysis and Performance Tracking
Business performance analysis shows how your company is doing right now. Key performance indicators (KPIs) make this simple. Examples include revenue growth, profit margin, and customer retention.
Performance tracking keeps those KPIs in front of your team. You spot problems early. You also see which actions deliver the best return.
Customer Behavior Analysis
Customer behavior analysis shows how people find, buy, and use your products. You learn what they love and where they drop off. That helps you improve offers and fix weak spots.
For example, a store may see that shoppers abandon carts at checkout. Analytics reveals why. The team then simplifies the page, and sales rise.
Market Trend Analysis
Market trend analysis helps you see changes before rivals do. You track demand, pricing, and shifts in customer taste. This supports smarter launches and better timing.
Predictive Analytics
Predictive analytics uses past data to forecast what may happen next. It can estimate demand, sales, or customer churn. Teams then prepare instead of reacting.
A retailer can stock more of a product before a busy season. A subscription business can reach out to customers likely to leave.
Real-Time Data Analysis
Real-time data analysis studies data the moment it arrives. It helps you act while the moment still matters. Fraud alerts, live inventory, and instant ad changes all depend on it.
Not every decision needs real-time speed. Use it where delays cost money or trust.
Strategic Planning
Strategic planning sets the long-term direction of a company. Analytics gives that plan a solid base. Leaders see where growth is strongest and where risks are rising.
Data insights also help set realistic goals. Teams can measure progress and adjust each quarter.
Types of Data Analytics and the Decisions They Support
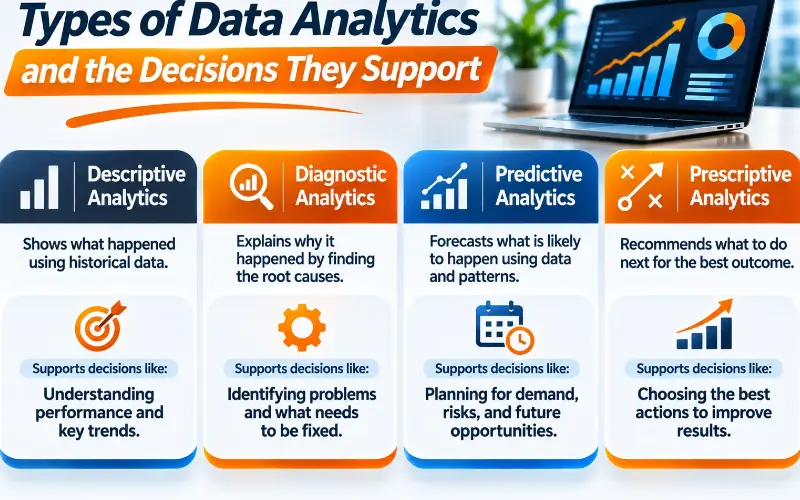
Each type of analytics answers a different question. Together, they cover the full decision cycle.
| Type of Analytics | Question It Answers | Example Decision |
| Descriptive | What happened? | Review last quarter’s sales by region |
| Diagnostic | Why did it happen? | Find why returns rose in one product line |
| Predictive | What will happen? | Forecast demand for the holiday season |
| Prescriptive | What should we do? | Choose the best pricing for each segment |
Most businesses begin with descriptive and diagnostic analytics. They then add predictive and prescriptive methods as their data matures.
Business Intelligence Tools and Data Analysis Tools
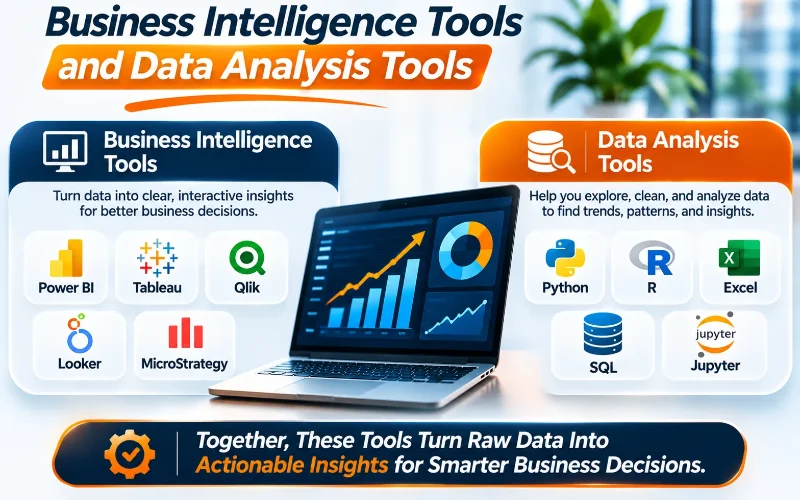
The right tools make analysis faster and easier to share. Business intelligence tools connect to your data and turn it into dashboards. Data analysis tools help specialists dig deeper.
Popular choices include:
- Microsoft Power BI: Builds interactive dashboards and reports for business teams.
- Tableau: Turns complex data into clear, shareable visuals.
- SQL: Lets analysts pull and shape data from databases.
- Python and R: Support advanced statistics and predictive analytics.
- Spreadsheets: Handle quick checks and simple reports.
Do not buy tools first. Define your questions, then choose tools that answer them. Business intelligence should serve your goals, not the other way around.
Why Data Accuracy and Data Quality Matter
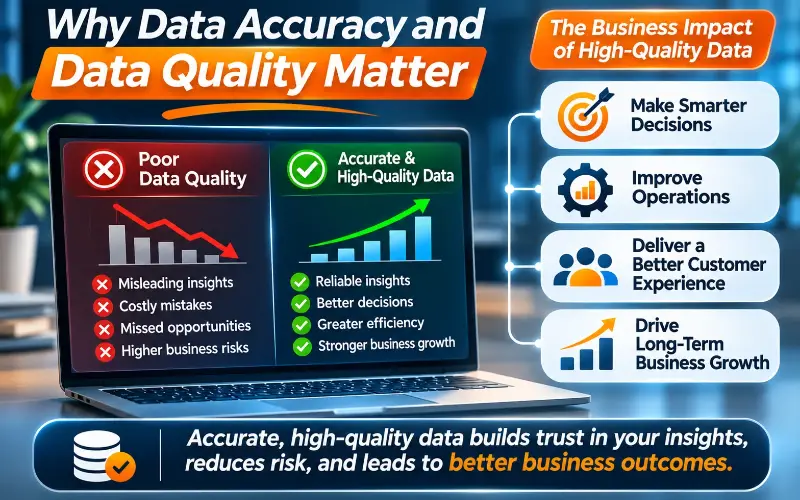
Bad data leads to bad decisions. If your numbers are wrong, your insights will mislead you. That can cost you money and trust.
Data accuracy means your data reflects reality. Data quality covers accuracy, completeness, consistency, and timeliness. All four matter for confident decisions.
Here are simple ways to protect both:
- Set clear rules for how data is entered and stored.
- Check for duplicates and missing values often.
- Use one shared definition for each KPI.
- Assign owners to your key data sets.
- Automate quality checks in your data pipelines.
Learn more in our guide to data quality management. Strong quality habits make every report more reliable.
Real-World Examples of Better Decisions with Data
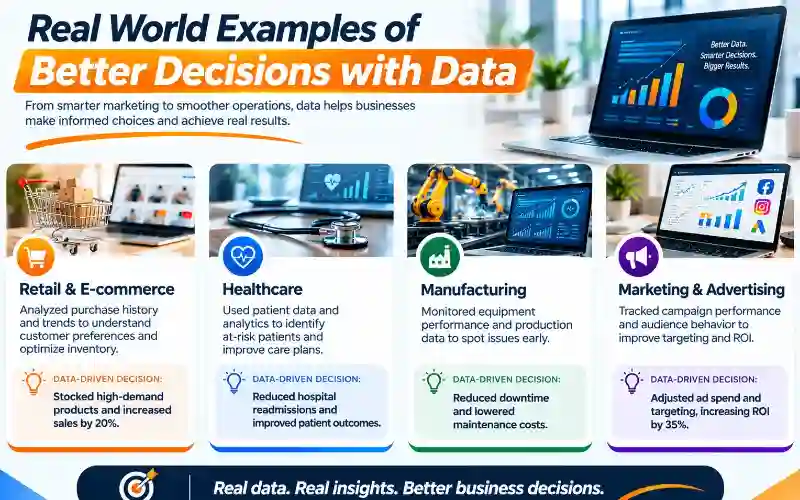
Examples show how analytics works in daily business life.
- Retail: A chain studies sales and weather data. It stocks more raincoats before a wet week.
- Marketing: A team compares campaign results across channels. It moves budget to the best performers.
- Healthcare: A clinic reviews patient wait times. It adjusts staff schedules and cuts delays.
- Finance: A bank scores transactions for fraud in seconds. It blocks suspicious activity fast.
- Manufacturing: A plant tracks machine sensor data. It fixes equipment before it breaks.
- Customer service: A support team spots common complaints. It updates guides and reduces repeat tickets.
Benefits of Using Data Analytics for Decisions
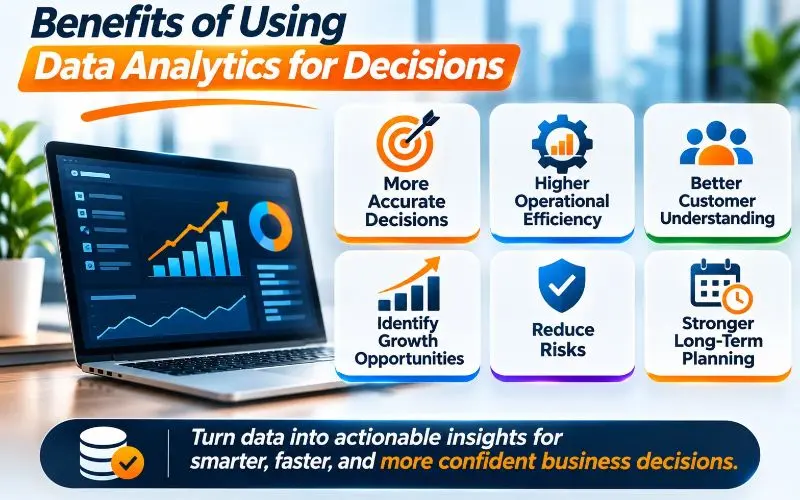
The gains show up across the whole company. Here are the biggest ones.
- Faster decisions: Teams find answers without long debates.
- Lower risk: Evidence reduces costly mistakes.
- Higher profits: You spot waste and double down on what works.
- Better customer experience: You learn what people truly want.
- Stronger teamwork: Shared data gives everyone the same facts.
- Clear accountability: Metrics show who owns each result.
Best Practices for Using Data Analytics in Decision Making
Follow these habits to get real value from your data.
- Start with a business question. Know what decision you need to make.
- Pick a few KPIs. Too many metrics create noise and confusion.
- Use trusted data. Fix quality issues before you build dashboards.
- Keep visuals simple. Clear charts help people act faster.
- Share insights widely. Give each team the data it needs.
- Test and learn. Run small experiments before big changes.
- Review results often. Check whether decisions delivered the expected outcome.
- Train your people. Data skills help everyone use insights with confidence.
Common Mistakes to Avoid
Even smart teams slip up. Watch for these traps.
- Collecting everything: More data is not always better data.
- Ignoring context: A number can mislead without the full story.
- Trusting weak data: Always check data accuracy first.
- Chasing vanity metrics: Focus on KPIs tied to real goals.
- Skipping action: Insights have no value if nobody acts on them.
- Working in silos: Share data across teams to avoid mixed signals.
How Wisdom Tech Cloud Services Can Help
Strong decisions start with a strong data foundation. Wisdom Tech Cloud Services helps businesses organize, connect, and use data with confidence. Explore our data and cloud services to see how we can support your analytics goals.
You can also read more practical guides on our data and cloud blog.
Frequently Asked Questions
How does data analytics help in decision-making?
Data analytics turns raw data into clear insights. It shows trends, risks, and opportunities. Leaders then choose actions based on facts instead of guesses.
What are the main types of data analytics?
The four main types are descriptive, diagnostic, predictive, and prescriptive. They explain what happened, why, what may happen, and what to do next.
What is the role of KPIs in data-driven decisions?
KPIs are measurable goals that track business performance. They show whether your decisions work. Good KPIs keep teams focused on the results that matter.
What tools do businesses use for data analytics?
Businesses use business intelligence tools like Power BI and Tableau. Analysts also use SQL, Python, and R for deeper analysis and predictive work.
Why is data quality important for decision-making?
Poor data quality leads to wrong insights and costly errors. Accurate, complete, and consistent data helps leaders trust their reports and act with confidence.
Can small businesses use data analytics?
Yes. Small businesses can start with simple tools like spreadsheets and free dashboards. Even basic sales and customer data can guide smarter choices.
How do I start using data analytics in my business?
Pick one business question. Collect the data that answers it. Clean it, analyze it, and act on what you learn. Then repeat and grow.